Note
Go to the end to download the full example code.
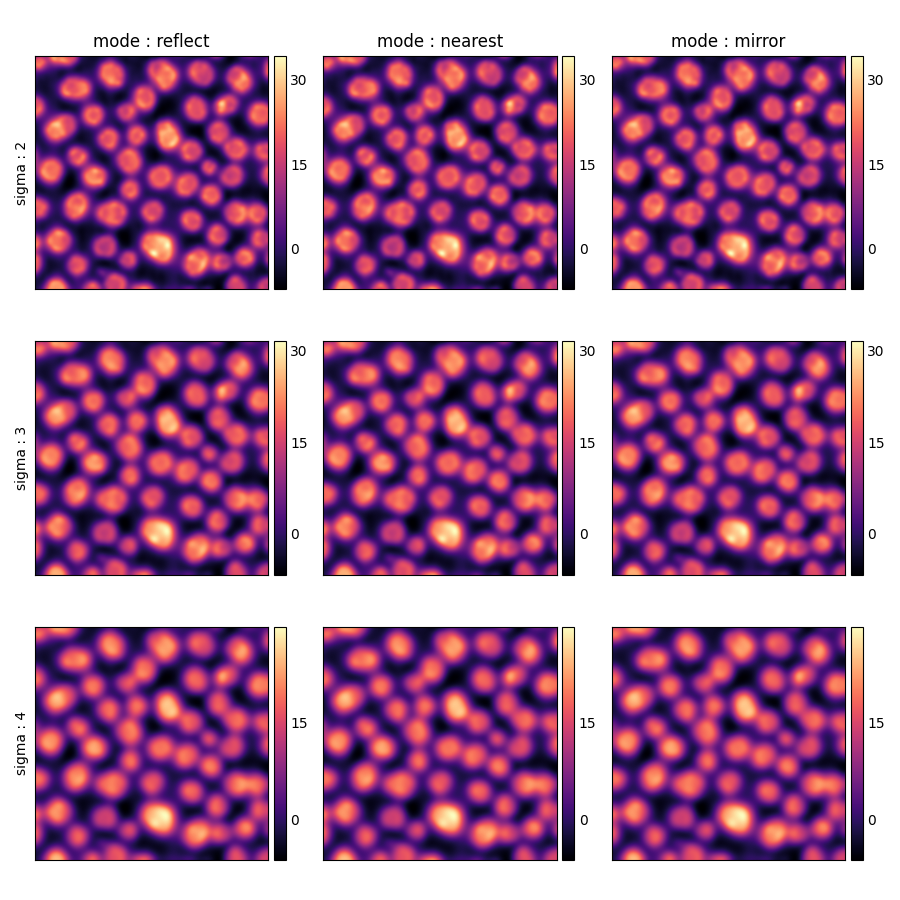
Interplay between function parameters using ParamGrid#
import seaborn_image as isns

img = isns.load_image("polymer")

g = isns.ParamGrid(
    img,
    "gaussian",
    row="sigma",
    col="mode",
    sigma=[2, 3, 4],
    mode=["reflect", "nearest", "mirror"],
    cmap="magma",
)
Total running time of the script: (0 minutes 0.794 seconds)