Note
Go to the end to download the full example code.
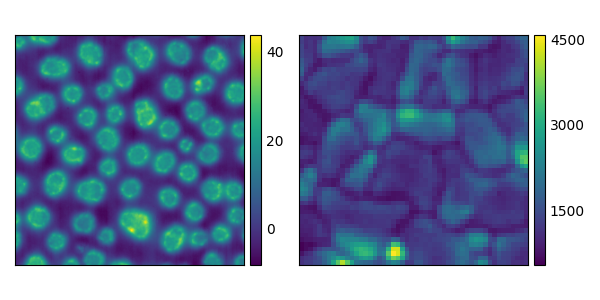
ImageGrid: Mutiple images on a single figure#
import seaborn_image as isns

# load images
pol = isns.load_image("polymer")
pl = isns.load_image("fluorescence")

g = isns.ImageGrid([pol, pl])
Total running time of the script: (0 minutes 0.408 seconds)