Ctrl+K

seaborn-image documentation

Site Navigation

  • Gallery
  • API Reference
  • Tutorial
  • License
  • Changelog
  • GitHub
  • Twitter

Site Navigation

  • Gallery
  • API Reference
  • Tutorial
  • License
  • Changelog
  • GitHub
  • Twitter

Section Navigation

  • 2-D image visualization
  • Apply image filter
  • Visualize image distribution
  • Fast Fourier Transform
  • 4D image data
  • Image filters
  • List of 3D images
  • ImageGrid: Mutiple images on a single figure
  • RGB channels in RGB image
  • Multi-dimensional images
  • Map function to transform 2D image
  • Interplay between function parameters using ParamGrid
  • Transform multi-dimensional images
  • ImageGrid: Apply changes to individual images
  • Outlier correction
  • Apply multiple transformations to 2-D image
  • Apply multiple transformations to list of 2-D images
  • Example gallery
  • List of 3D images

Note

Go to the end to download the full example code

List of 3D images#

plot ImageGrid 3d list
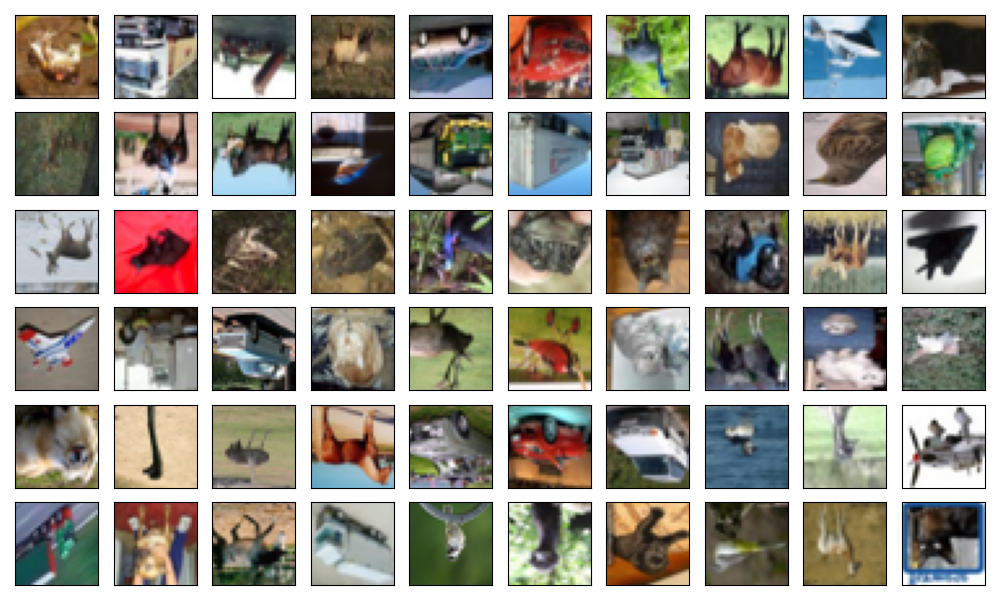
import seaborn_image as isns

cifar_list = isns.load_image("cifar10 list")

g = isns.ImageGrid(cifar_list, cbar=False, height=1, col_wrap=10)

Total running time of the script: (0 minutes 1.652 seconds)

Download Jupyter notebook: plot_ImageGrid_3d_list.ipynb

Download Python source code: plot_ImageGrid_3d_list.py

Gallery generated by Sphinx-Gallery

previous

Image filters

next

ImageGrid: Mutiple images on a single figure

Edit on GitHub
Show Source

© Copyright 2020 - 2024, Sarthak Jariwala.

Created using Sphinx 7.1.2.

Built with the PyData Sphinx Theme 0.14.4.