Utilities
- seaborn_image.scientific_ticks(ax, which='y')
Convert axis ticks to scientific
- Parameters:
ax (matplotlib.axes.Axes) – Axis where ticks are to be converted
which (str, optional) – Which axis ticks to convert to scientific, default to “y”. Options include : “y”, “x”, “both”
- Raises:
ValueError – If which is not one of [‘y’, ‘x’, ‘both’]
Examples
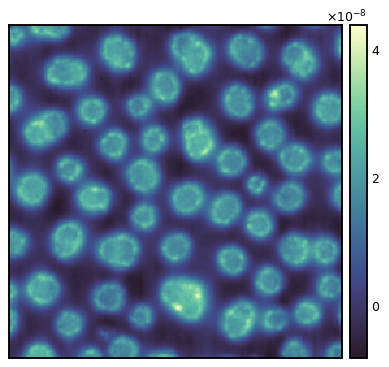
Set colorbar yaxis ticks to scientific
>>> import seaborn_image as isns
>>> img = isns.load_image("polymer") * 1e-9
>>> ax = isns.imgplot(img)
>>> # get colorbar axes
>>> cax = plt.gcf().axes[1]
>>> isns.scientific_ticks(cax)
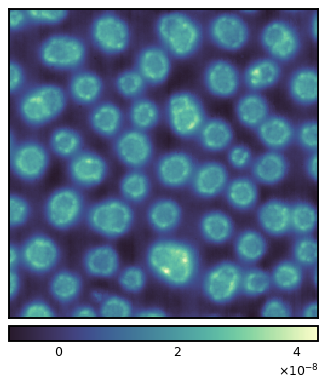
Set colorbar xaxis ticks to scientific
>>> import seaborn_image as isns
>>> img = isns.load_image("polymer") * 1e-9
>>> ax = isns.imgplot(img, orientation="h")
>>> # get colorbar axes
>>> cax = plt.gcf().axes[1]
>>> isns.scientific_ticks(cax, which="x")
- seaborn_image.despine(fig=None, ax=None, which='all')
Remove the specified spine/s from a given matplotlib.Axes or all the axes from a given matplotlib.Figure.
- Parameters:
fig (matplotlib.figure.Figure, optional) – The figure where all the axes are to be despined, by default None
ax (matplotlib.axes.Axes, optional) – The axes to despine, by default None
which (str or list, optional) – The specific spine to remove, by default “all”
- Raises:
ValueError – If the which is not in the list of spines : [“all”, “top”, “bottom”, “right”, “left”]
TypeError – If which is not a str or list
Examples
Despine all axes in a figure
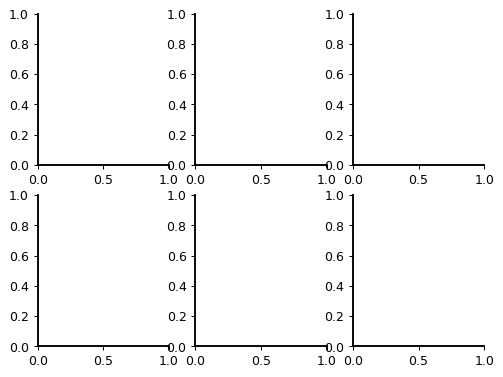
>>> import seaborn_image as isns
>>> fig, axes = plt.subplots(nrows=2, ncols=3)
>>> isns.despine()
Or equivalently
>>> import seaborn_image as isns
>>> fig, axes = plt.subplots(nrows=2, ncols=3)
>>> isns.despine(fig)

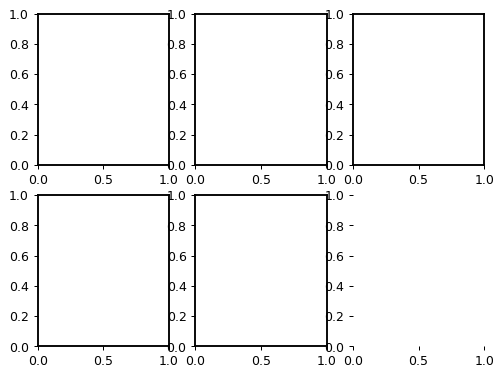
Despine a specific axis
>>> import seaborn_image as isns
>>> fig, axes = plt.subplots(nrows=2, ncols=3)
>>> isns.despine(ax=axes[-1][-1])
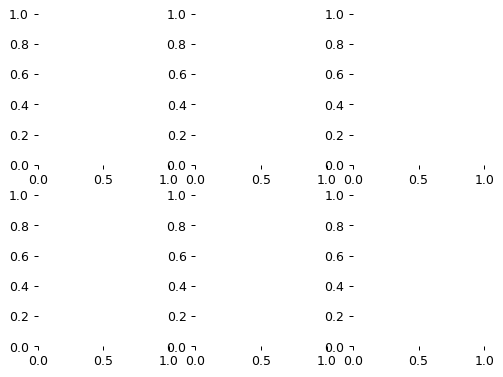
Despine only top and right axes
>>> import seaborn_image as isns
>>> fig, axes = plt.subplots(nrows=2, ncols=3)
>>> isns.despine(which=["top", "right"])