seaborn_image.imghist
- seaborn_image.imghist(data, cmap=None, bins=None, vmin=None, vmax=None, alpha=None, origin=None, interpolation=None, norm=None, robust=False, perc=(2, 98), dx=None, units=None, dimension=None, describe=False, map_func=None, cbar=True, orientation='v', cbar_log=False, cbar_label=None, cbar_ticks=None, showticks=False, despine=None, height=5, aspect=1.75, **kwargs)
Plot data as a 2-D image with histogram showing the distribution of the data. Options to add scalebar, colorbar, title.
- Parameters
data (array-like) – Image data. Supported array shapes are all matplotlib.pyplot.imshow array shapes
bins (int, optional) – Histogram bins, by default None. If None, auto is used.
cmap (str or matplotlib.colors.Colormap, optional) – Colormap for image. Can be a seaborn-image colormap or default matplotlib colormaps or any other colormap converted to a matplotlib colormap, by default None
gray (bool, optional) – If True and data is RGB image, it will be converted to grayscale. If True and cmap is None, cmap will be set to “gray”, by default None
vmin (float, optional) – Minimum data value that colormap covers, by default None
vmax (float, optional) – Maximum data value that colormap covers, by default None
alpha (float or array-like, optional) – matplotlib.pyplot.imshow alpha blending value from 0 (transparent) to 1 (opaque), by default None
origin (str, optional) – Image origin, by default None
interpolation (str, optional) – matplotlib.pyplot.imshow interpolation method used, by default None
norm (matplotlib.colors.Normalize, optional) – matplotlib Normalize instance used to scale scalar data before mapping to colors using cmap
robust (bool, optional) – If True and vmin or vmax are None, colormap range is calculated based on the percentiles defined in perc parameter, by default False
perc (tuple or list, optional) – If robust is True, colormap range is calculated based on the percentiles specified instead of the extremes, by default (2, 98) - 2nd and 98th percentiles for min and max values
dx (float, optional) – Size per pixel of the image data. Specifying dx and units adds a scalebar to the image, by default None
units (str, optional) – Units of dx, by default None
dimension (str, optional) –
dimension of dx and units, by default None Options include (similar to matplotlib_scalebar):
”si” : scale bar showing km, m, cm, etc.
”imperial” : scale bar showing in, ft, yd, mi, etc.
”si-reciprocal” : scale bar showing 1/m, 1/cm, etc.
”angle” : scale bar showing °, ʹ (minute of arc) or ʹʹ (second of arc)
”pixel” : scale bar showing px, kpx, Mpx, etc.
describe (bool, optional) – Brief statistical description of the data, by default False
map_func (callable, optional) – Transform input image data using this function. All function arguments must be passed as kwargs.
cbar (bool, optional) – Specify if a colorbar is to be added to the image, by default True. If data is RGB image, cbar is False
orientation (str, optional) –
Specify the orientaion of colorbar, by default “v”. Options include :
’h’ or ‘horizontal’ for a horizontal colorbar to the bottom of the image.
’v’ or ‘vertical’ for a vertical colorbar to the right of the image.
cbar_log (bool, optional) – Log scale colormap and colorbar
cbar_label (str, optional) – Colorbar label, by default None
cbar_ticks (list, optional) – List of colorbar ticks, by default None
showticks (bool, optional) – Show image x-y axis ticks, by default False
despine (bool, optional) – Remove axes spines from image axes as well as colorbar axes, by default None
height (int or float, optional) – Size of the individual images, by default 5.
aspect (int or float, optional) – Aspect ratio of individual images, by default 1.75.
- Returns
Matplotlib figure.
- Return type
matplotlib.figure.Figure
- Raises
TypeError – if bins is not a positive integer
Examples
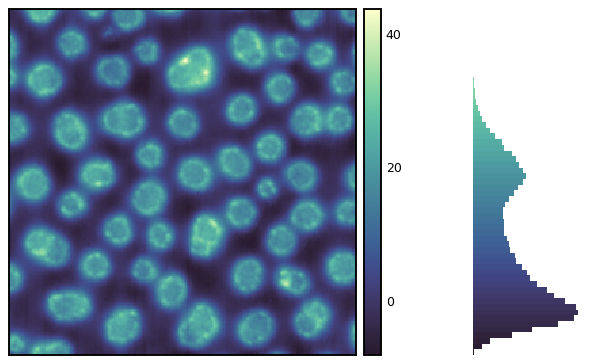
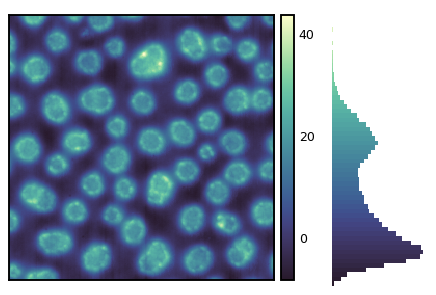
Plot distribution alongside the image
>>> import seaborn_image as isns
>>> img = isns.load_image("polymer")
>>> isns.imghist(img)
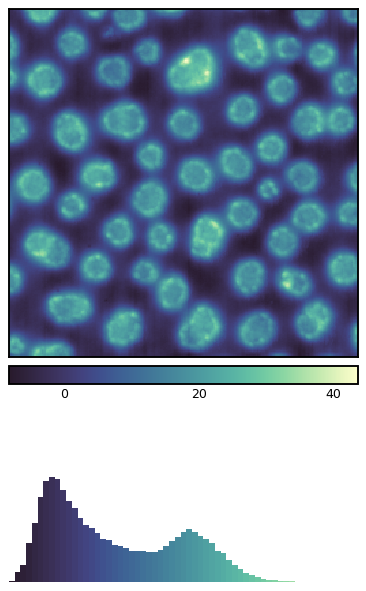
Change the orientation
>>> isns.imghist(img, orientation="h")
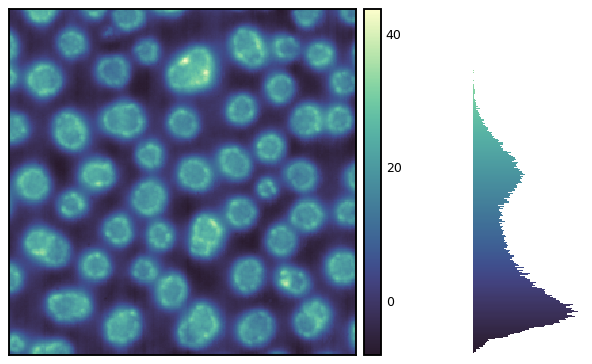
Change the number of bins
>>> isns.imghist(img, bins=300)
Change height and aspect ratio of the figure
>>> isns.imghist(img, height=4, aspect=1.5)
Get image statistics
>>> isns.imghist(img, describe=True)

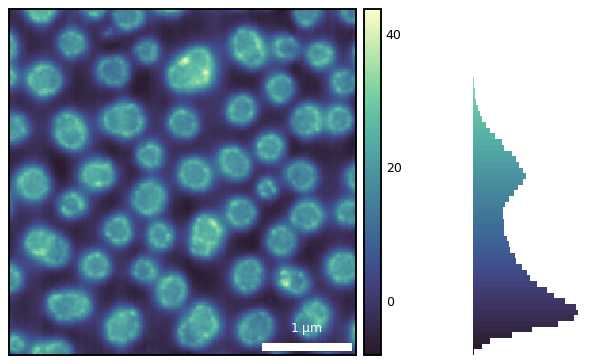
Add a scalebar
>>> isns.imghist(img, dx=15, units="nm")
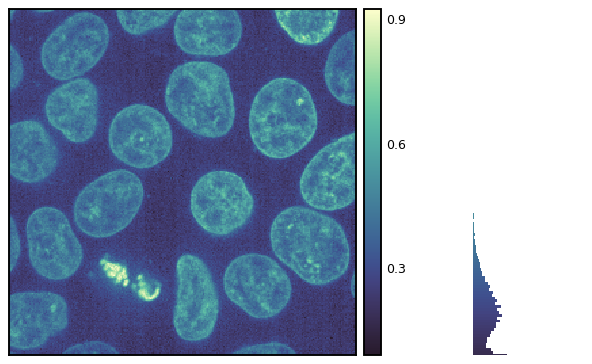
Map a function to transform input image
>>> from skimage.exposure import adjust_gamma
>>> cells = isns.load_image("cells")[:, :, 32]
>>> isns.imghist(cells, map_func=adjust_gamma, gamma=0.5)
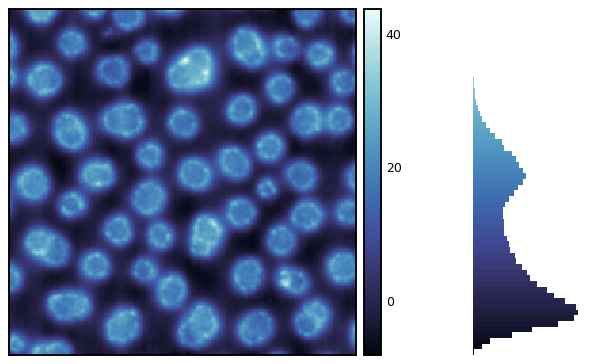
Change colormaps
>>> isns.imghist(img, cmap="ice")