seaborn_image.FilterGrid
- class seaborn_image.FilterGrid(data, filt, *, row=None, col=None, col_wrap=None, height=3, aspect=1, cmap=None, alpha=None, origin=None, interpolation=None, dx=None, units=None, dimension=None, cbar=True, orientation='v', cbar_log=False, cbar_label=None, cbar_ticks=None, showticks=False, despine=None, **kwargs)
Generate a grid of images with the specific filter applied to all the images. This class allows exploration of different parameters of the filters across the rows and columns of the grid. Additional filter parameters that are not to be varied can also be passed.
- Parameters
data – Image data (array-like). Supported array shapes are all matplotlib.pyplot.imshow array shapes
filt (str or callable) – Filter name or function to be applied.
row (str, optional) – Parameter name that is to be displayed along the row. Defaults to None.
col (str, optional) – Parameter name that is to be displayed along the column. Defaults to None.
col_wrap (int, optional) – Number of columns to display if col is not None and row is None. Defaults to None.
height (int or float, optional) – Size of the individual images. Defaults to 3.
aspect (int or float, optional) – Aspect ratio of individual images. Defaults to 1.
cmap (str or matplotlib.colors.Colormap, optional) – Image colormap. Defaults to None.
alpha (float or array-like, optional) – matplotlib.pyplot.imshow alpha blending value from 0 (transparent) to 1 (opaque), by default None
origin (str, optional) – Image origin, by default None
interpolation (str, optional) – matplotlib.pyplot.imshow interpolation method used, by default None
dx (float, optional) – Size per pixel of the image data. If scalebar is required, dx and units must be sepcified. Defaults to None.
units (str, optional) – Units of dx. Defaults to None.
dimension (str, optional) –
Dimension of dx and units. Options include :
”si” : scale bar showing km, m, cm, etc.
”imperial” : scale bar showing in, ft, yd, mi, etc.
”si-reciprocal” : scale bar showing 1/m, 1/cm, etc.
”angle” : scale bar showing °, ʹ (minute of arc) or ʹʹ (second of arc).
”pixel” : scale bar showing px, kpx, Mpx, etc.
Defaults to None.
cbar (bool, optional) – Specify if a colorbar is required or not. Defaults to True.
orientation (str, optional) –
Specify the orientaion of colorbar. Option include :
’h’ or ‘horizontal’ for a horizontal colorbar to the bottom of the image.
’v’ or ‘vertical’ for a vertical colorbar to the right of the image.
Defaults to ‘v’.
cbar_log (bool, optional) – Log scale colormap and colorbar
cbar_label (str, optional) – Colorbar label. Defaults to None.
cbar_ticks (list, optional) – List of colorbar ticks. Defaults to None.
showticks (bool, optional) – Show image x-y axis ticks. Defaults to False.
despine (bool, optional) – Remove axes spines from image axes as well as colorbar axes. Defaults to None.
**kwargs (Additional parameters as keyword arguments to be passed to the underlying filter specified.) – Returns
------- – A seabron_image.FilterGrid object
- Raises
TypeError – If row is not a str
ValueError – If row is specified without passing the parameter as a keyword argument
TypeError – If col is not a str
ValueError – If col is specified without passing the parameter as a keyword argument
ValueError – If col_wrap is specified when row is not None
Examples
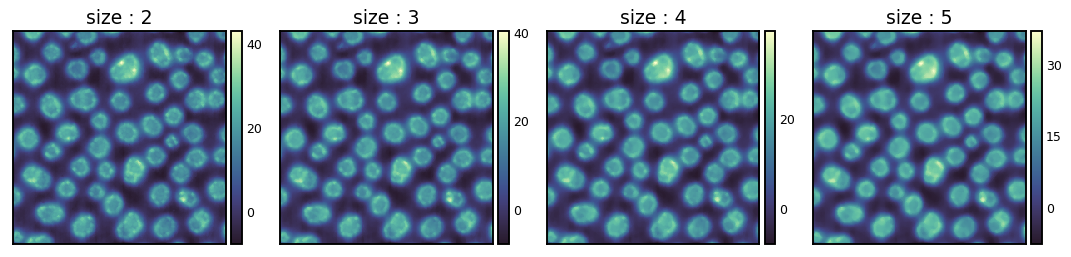
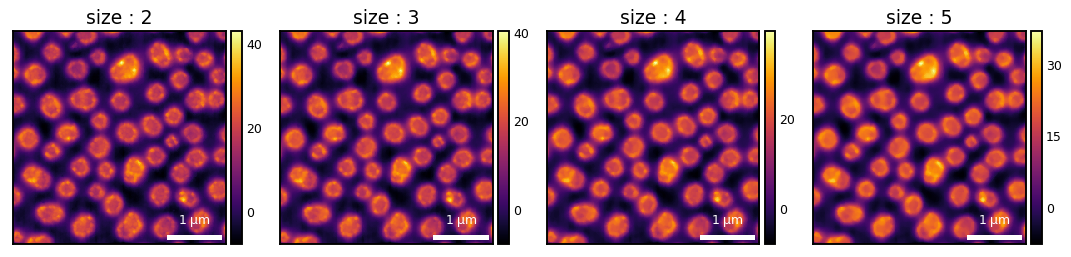
Specify a filter with different parameters along the columns
>>> import seaborn_image as isns
>>> img = isns.load_image("polymer")
>>> g = isns.FilterGrid(img, "median", col="size", size=[2,3,4,5])
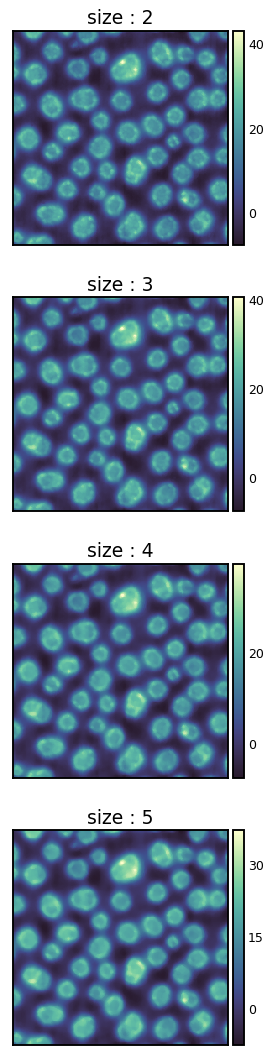
Or rows
>>> g = isns.FilterGrid(img, "median", row="size", size=[2,3,4,5])
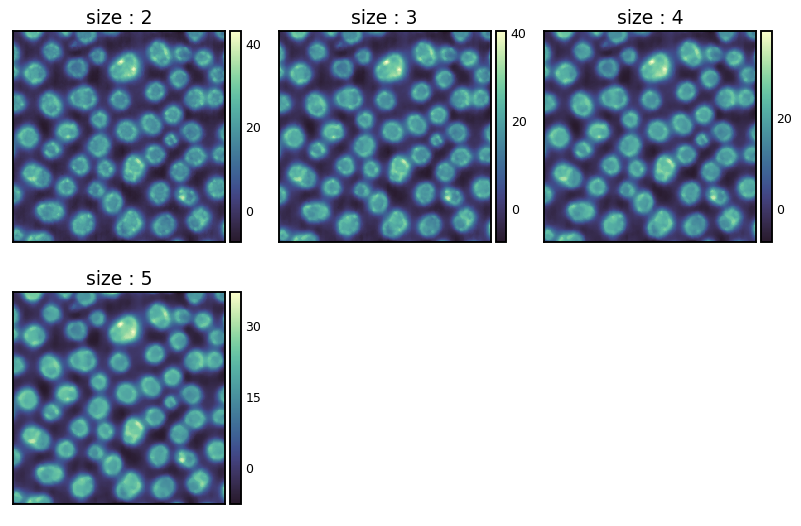
Use col_wrap to control column display
>>> g = isns.FilterGrid(img, "median", col="size", size=[2,3,4,5], col_wrap=3)
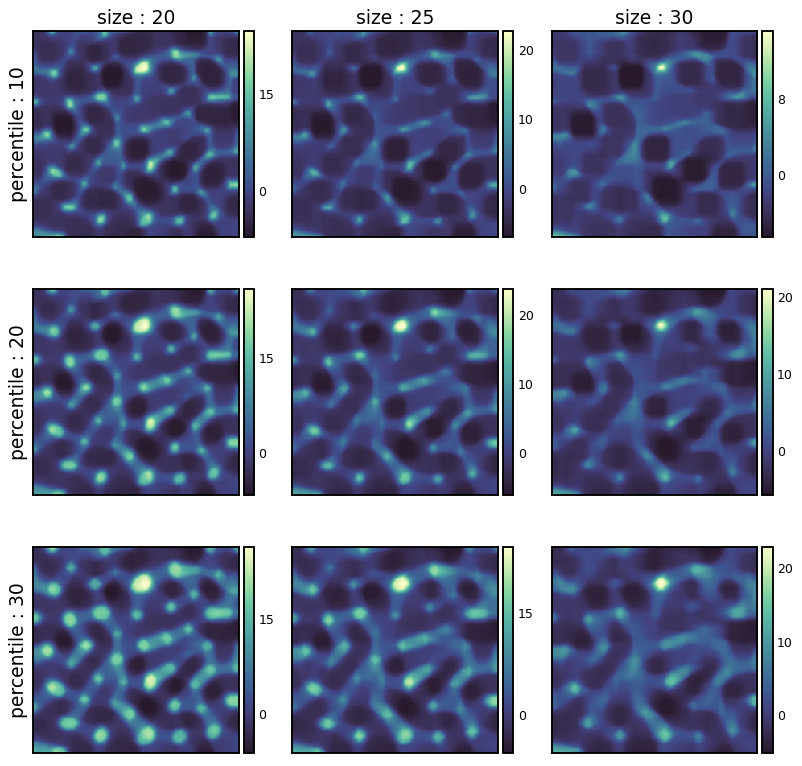
Use col and row to display different parameters along the columns and rows
>>> g = isns.FilterGrid(img,
...                     "percentile",
...                     row="percentile",
...                     col="size",
...                     percentile=[10,20,30],
...                     size=[20,25,30],)
Specify additional keyword arguments for the filter
>>> g = isns.FilterGrid(img, "median", col="size", size=[2,3,4,5], mode="reflect")

General image controls such as changing colormap, scalebar, etc.
>>> g = isns.FilterGrid(
...                     img,
...                     "median",
...                     col="size",
...                     size=[2,3,4,5],
...                     cmap="inferno",
...                     dx=15,
...                     units="nm")
- map_filter_to_grid()
Map specified filter with row and col paramters to the image grid.