seaborn-image: image data visualization
Description
Seaborn-image is a Python image visualization library based on matplotlib and provides a high-level API to draw attractive and informative images quickly and effectively.
It is heavily inspired by seaborn, a high-level visualization library for drawing attractive statistical graphics in Python.
To view example images, check out the gallery page and reference. For specific how-to questions, refer to the tutorial page.
Check out the source code on github. If you come across any bugs/issues, please open an issue.
Installation
pip install -U seaborn-image
Quick Usage
Visualize 2-D images
import seaborn_image as isns
"""Global settings for images"""
isns.set_context("notebook")
isns.set_image(cmap="deep", despine=True)
isns.set_scalebar(color="red")
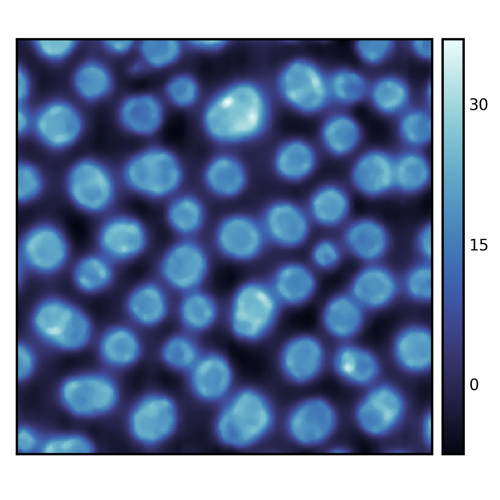
pol = isns.load_image("polymer")
"""Image with a scalebar"""
ax = isns.imgplot(pol, dx=0.01, units="um")
"""Get basic image stats"""
isns.imgplot(data, describe=True)
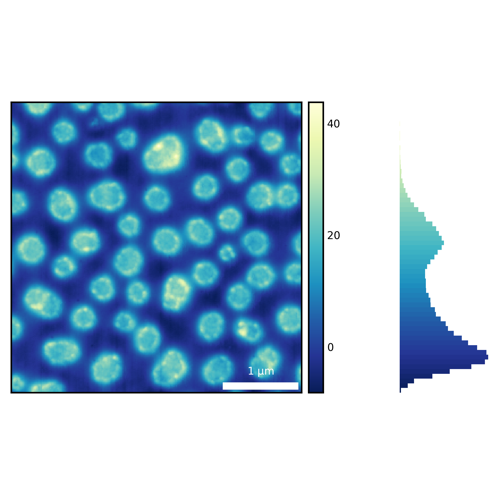
Visualize image distribution
f = isns.imghist(pol)
Multi-dimensional images
cells = isns.load_image("cells")

g = isns.ImageGrid(cells, slices=[10, 20, 30, 40])
For more information check out examples in tutorial, api and gallery.