seaborn_image.rgbplot#
- seaborn_image.rgbplot(data, *, col_wrap=3, height=3, aspect='auto', cmap=None, alpha=None, origin=None, vmin=None, vmax=None, interpolation=None, dx=None, units=None, dimension=None, cbar=True, orientation='v', cbar_label=None, cbar_ticks=None, showticks=False, despine=None, extent=None)#
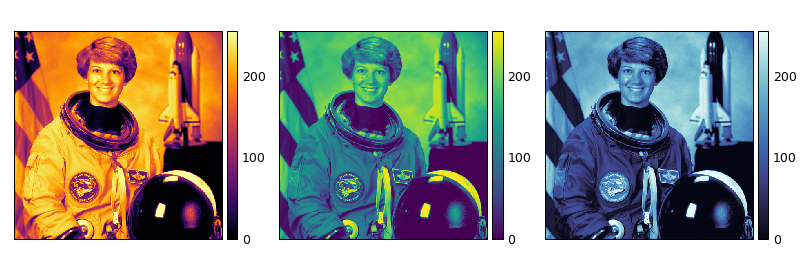
Split and plot the red, green and blue channels of an RGB image.
- Parameters:
data – RGB image data as 3-D array.
col_wrap (int, optional) – Number of columns to display. Defaults to 3.
height (int or float, optional) – Size of the individual images. Defaults to 3.
aspect (int, float or 'auto', optional) – Aspect ratio of individual images, when set to ‘auto’, it calculates the aspect ratio of the images passed. Defaults to ‘auto’.
cmap (str or matplotlib.colors.Colormap or list, optional) – Image colormap or a list of colormaps. Defaults to None.
alpha (float or array-like, optional) – matplotlib.pyplot.imshow alpha blending value from 0 (transparent) to 1 (opaque), by default None
origin (str, optional) – Image origin, by default None
vmin (float or list of floats, optional) – Minimum data value that colormap covers, by default None
vmax (float or list of floats, optional) – Maximum data value that colormap covers, by default None
interpolation (str, optional) – matplotlib.pyplot.imshow interpolation method used, by default None
dx (float or list, optional) – Size per pixel of the image data. If scalebar is required, dx and units must be sepcified. Can be a list of floats. Defaults to None.
units (str or list, optional) – Units of dx. Can be a list of str. Defaults to None.
dimension (str or list, optional) –
Dimension of dx and units. Options include :
”si” : scale bar showing km, m, cm, etc.
”imperial” : scale bar showing in, ft, yd, mi, etc.
”si-reciprocal” : scale bar showing 1/m, 1/cm, etc.
”angle” : scale bar showing °, ʹ (minute of arc) or ʹʹ (second of arc).
”pixel” : scale bar showing px, kpx, Mpx, etc.
Can be a list of str. Defaults to None.
cbar (bool or list, optional) – Specify if a colorbar is required or not. Can be a list of bools. Defaults to True.
orientation (str, optional) –
Specify the orientaion of colorbar. Option include :
’h’ or ‘horizontal’ for a horizontal colorbar to the bottom of the image.
’v’ or ‘vertical’ for a vertical colorbar to the right of the image.
Defaults to ‘v’.
cbar_label (str or list, optional) – Colorbar label. Can be a list of str. Defaults to None.
cbar_ticks (list, optional) – List of colorbar ticks. Defaults to None.
showticks (bool, optional) – Show image x-y axis ticks. Defaults to False.
despine (bool, optional) – Remove axes spines from image axes as well as colorbar axes. Defaults to None.
extent (floats (left, right, bottom, top), optional) – The bounding box in data coordinates that the image will fill. The image is stretched individually along x and y to fill the box.
- Return type:
seaborn_image.ImageGrid
- Raises:
ValueError – If data dimension is not 3
ValueError – If data channels are not 3
Examples
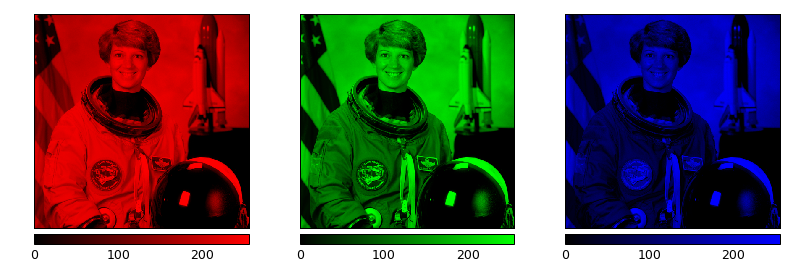
Split and plot the channels of a RGB image
>>> import seaborn_image as isns; isns.set_image(origin="upper")
>>> from skimage.data import astronaut
>>> g = isns.rgbplot(astronaut())
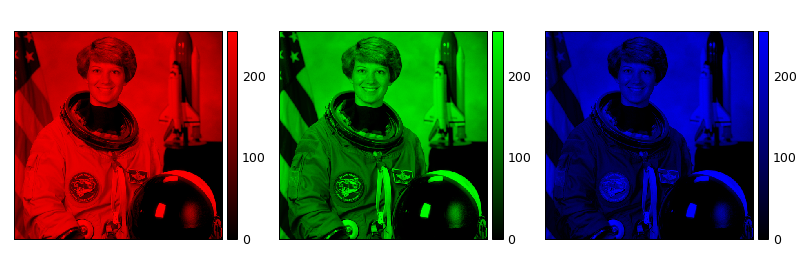
Hide colorbar
>>> g = isns.rgbplot(astronaut(), cbar=False)
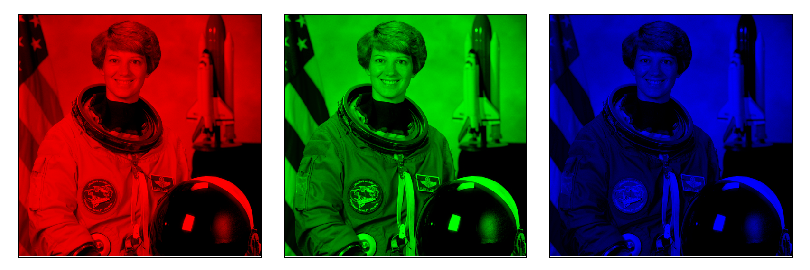
Change colormap
>>> g = isns.rgbplot(astronaut(), cmap="deep")
>>> g = isns.rgbplot(astronaut(), cmap=["inferno", "viridis", "ice"])
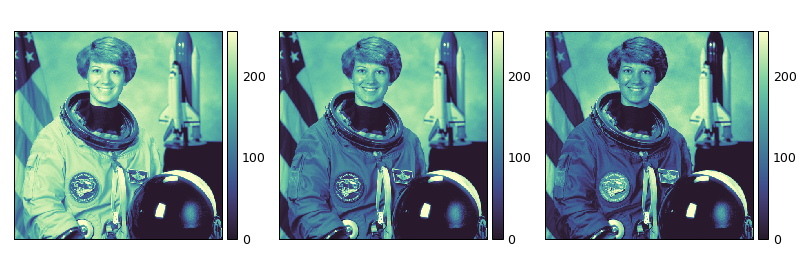
Horizontal colorbar
>>> g = isns.rgbplot(astronaut(), orientation="h")