seaborn_image.filterplot#
- seaborn_image.filterplot(data, filt='gaussian', *, ax=None, cmap=None, vmin=None, vmax=None, alpha=None, origin=None, interpolation=None, robust=False, perc=(2, 98), diverging=False, dx=None, units=None, dimension=None, describe=False, cbar=True, orientation='v', cbar_log=False, cbar_label=None, cbar_ticks=None, showticks=False, despine=None, extent=None, **kwargs)#
Apply N-dimensional filters and plot the filterd data as 2-D image with options to add scalebar, colorbar, titles and configure similar to imgplot
- Parameters:
data (array-like) – Image data. Supported array shapes are all matplotlib.pyplot.imshow array shapes
filt (str or callable, optional) – Filter name or function to be applied. Filter name can be a string from seaborn_image.implemented_filters or a callable filter. Defaults to “gaussian”.
ax (matplotlib.axes.Axes, optional) – Matplotlib axes to plot image on. If None, figure and axes are auto-generated, by default None
cmap (str or matplotlib.colors.Colormap, optional) – Colormap for image. Can be a seaborn-image colormap or default matplotlib colormaps or any other colormap converted to a matplotlib colormap, by default None
gray (bool, optional) – If True and data is RGB image, it will be converted to grayscale. If True and cmap is None, cmap will be set to “gray”, by default None
vmin (float, optional) – Minimum data value that colormap covers, by default None
vmax (float, optional) – Maximum data value that colormap covers, by default None
alpha (float or array-like, optional) – matplotlib.pyplot.imshow alpha blending value from 0 (transparent) to 1 (opaque), by default None
origin (str, optional) – Image origin, by default None
interpolation (str, optional) – matplotlib.pyplot.imshow interpolation method used, by default None
robust (bool, optional) – If True and vmin or vmax are None, colormap range is calculated based on the percentiles defined in perc parameter, by default False
perc (tuple or list, optional) – If robust is True, colormap range is calculated based on the percentiles specified instead of the extremes, by default (2, 98) - 2nd and 98th percentiles for min and max values
dx (float, optional) – Size per pixel of the image data. Specifying dx and units adds a scalebar to the image, by default None
diverging (bool, optional) – If True, vmax and vmin are adjusted so they have the same absolute value, making the diverging color maps show 0 at the middle.
units (str, optional) – Units of dx, by default None
dimension (str, optional) –
dimension of dx and units, by default None Options include (similar to matplotlib_scalebar):
”si” : scale bar showing km, m, cm, etc.
”imperial” : scale bar showing in, ft, yd, mi, etc.
”si-reciprocal” : scale bar showing 1/m, 1/cm, etc.
”angle” : scale bar showing °, ʹ (minute of arc) or ʹʹ (second of arc)
”pixel” : scale bar showing px, kpx, Mpx, etc.
describe (bool, optional) – Brief statistical description of the data, by default True
cbar (bool, optional) – Specify if a colorbar is to be added to the image, by default True. If data is RGB image, cbar is False
orientation (str, optional) –
Specify the orientaion of colorbar, by default “v”. Options include :
’h’ or ‘horizontal’ for a horizontal colorbar to the bottom of the image.
’v’ or ‘vertical’ for a vertical colorbar to the right of the image.
cbar_log (bool, optional) – Log scale colormap and colorbar
cbar_label (str, optional) – Colorbar label, by default None
cbar_ticks (list, optional) – List of colorbar ticks, by default None
showticks (bool, optional) – Show image x-y axis ticks, by default False
despine (bool, optional) – Remove axes spines from image axes as well as colorbar axes, by default None
extent (floats (left, right, bottom, top), optional) – The bounding box in data coordinates that the image will fill. The image is stretched individually along x and y to fill the box.
**kwargs (optional) – Any additional parameters to be passed to the specific filt chosen. For instance, “sigma” or “size” or “mode” etc.
- Returns:
Matplotlib axes where the image is drawn.
- Return type:
matplotlib.axes.Axes
- Raises:
TypeError – if filt is not a string type or callable function
NotImplementedError – if a filt that is not implemented is specified
TypeError – if describe is not a bool
Examples
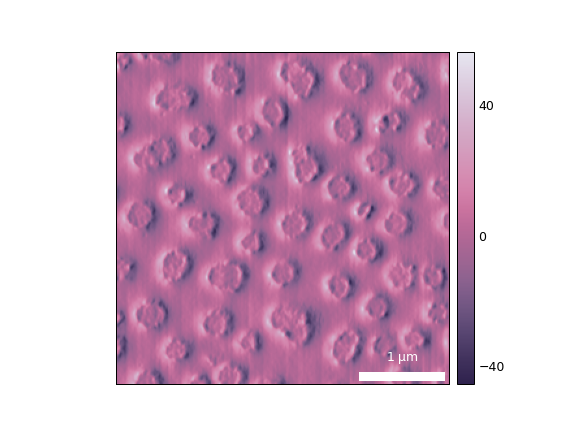
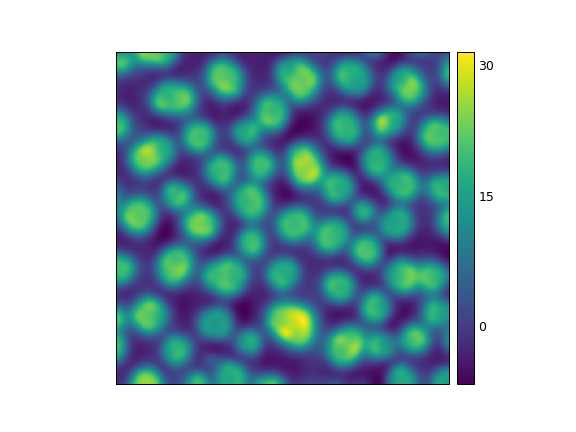
Use default gaussian filter
>>> import seaborn_image as isns
>>> img = isns.load_image("polymer")
>>> isns.filterplot(img, sigma=3)
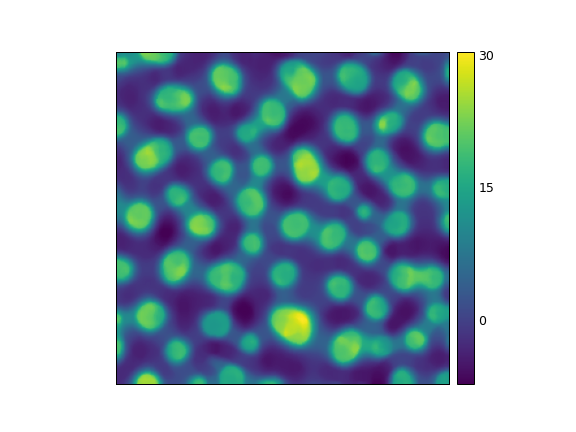
Specify an image filter with specific parameters
>>> isns.filterplot(img, "percentile", percentile=35, size=10)
filter can also be a function
>>> import scipy.ndimage as ndi
>>> isns.filterplot(img, ndi.gaussian_filter, sigma=2.5)

Specify other image parameters for visualization along with the filter
>>> isns.filterplot(img, "sobel", dx=15, units="nm", cmap="acton")