seaborn_image.fftplot#
- seaborn_image.fftplot(data, *, window_type=None, shift=True, log=True, ax=None, cmap='viridis', showticks=False, despine=None, **kwargs)#
Perform and visualize fast fourier transform of input image.
- Parameters:
data (array-like) – Image data. Supported array shapes are all matplotlib.pyplot.imshow array shapes
window_type (string, float or tuple, optional) – The type of window to be created. Any window type supported by scipy.signal.get_window is allowed here. See the scikit-image documentation https://scikit-image.org/docs/stable/api/skimage.filters.html#skimage.filters.window or the SciPy documentation https://docs.scipy.org/doc/scipy/reference/generated/scipy.signal.windows.get_window.html for the supported window types, by default None
shift (bool, optional) – If True, this will shift the DC component to the center, by default True
log (bool, optional) – If true, takes the magnitude spectrum of the frequency transform, by default True
ax (matplotlib.axes.Axes, optional) – Matplotlib axes to plot image on. If None, figure and axes are auto-generated, by default None
cmap (str or matplotlib.colors.Colormap, optional) – Colormap for image, by default “viridis”
showticks (bool, optional) – Show image x-y axis ticks, by default False
despine (bool, optional) – Remove axes spines from image axes, by default None
**kwargs (optional) – Any additional parameters to be passed to skimage.filters.window. For more information see https://scikit-image.org/docs/stable/api/skimage.filters.html#skimage.filters.window
- Returns:
Matplotlib axes where the image is drawn
- Return type:
matplotlib.axes.Axes
- Raises:
ValueError – If input image is RGB image
Examples
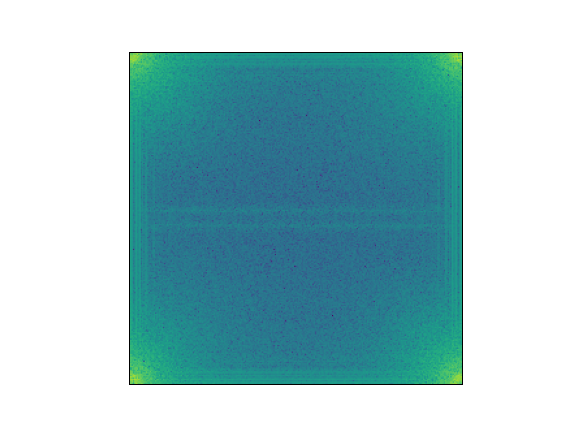
Perform fast-fourier transform and visualize it
>>> import seaborn_image as isns
>>> img = isns.load_image("polymer")
>>> isns.fftplot(img)
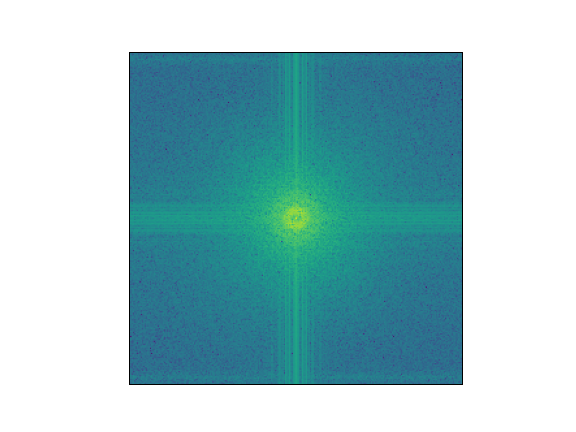
Specify a window type
>>> isns.fftplot(img, window_type="hann")
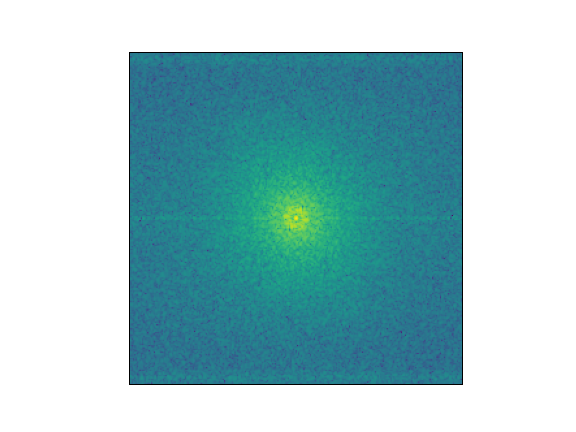
>>> isns.fftplot(img, window_type=('tukey', 0.8))
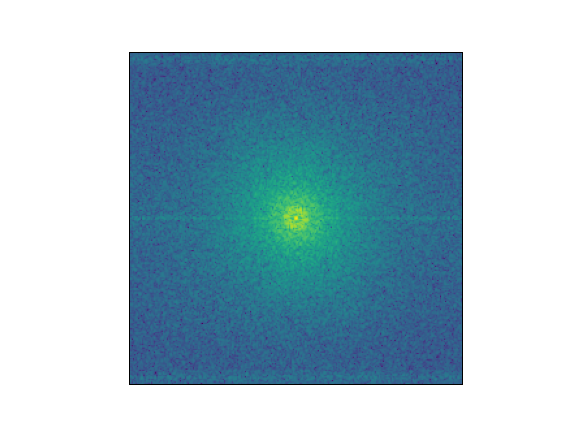
Don’t shift the DC comppnent to the center
>>> isns.fftplot(img, shift=False)