seaborn_image.ParamGrid#
- class seaborn_image.ParamGrid(data, map_func, *, row=None, col=None, col_wrap=None, height=3, aspect='auto', cmap=None, alpha=None, origin=None, vmin=None, vmax=None, interpolation=None, dx=None, units=None, dimension=None, cbar=True, orientation='v', cbar_log=False, cbar_label=None, cbar_ticks=None, showticks=False, despine=None, extent=None, **kwargs)#
This class allows exploration of different parameters of a function across the rows and columns of the grid. Additional function parameters that are not to be varied can also be passed.
Generates a grid of images with the specific function applied to all the images.
- Parameters:
data – Image data (array-like). Supported array shapes are all matplotlib.pyplot.imshow array shapes
map_func (callable or str) – Function to be applied/mapped to data. Can be any callable that accepts data as the the first input parameter. If using a str, must one of the implemented filter functions in seaborn_image. You can check implemented filters using seaborn_image.implemented_filters().
row (str, optional) – Parameter name that is to be displayed along the row. Defaults to None.
col (str, optional) – Parameter name that is to be displayed along the column. Defaults to None.
col_wrap (int, optional) – Number of columns to display if col is not None and row is None. Defaults to None.
height (int or float, optional) – Size of the individual images. Defaults to 3.
aspect (int, float or 'auto', optional) – Aspect ratio of individual images, when set to ‘auto’, it calculates the aspect ratio of the images passed. Defaults to ‘auto’.
cmap (str or matplotlib.colors.Colormap, optional) – Image colormap. Defaults to None.
alpha (float or array-like, optional) – matplotlib.pyplot.imshow alpha blending value from 0 (transparent) to 1 (opaque), by default None
origin (str, optional) – Image origin, by default None
vmin (float or list of floats, optional) – Minimum data value that colormap covers, by default None
vmax (float or list of floats, optional) – Maximum data value that colormap covers, by default None
interpolation (str, optional) – matplotlib.pyplot.imshow interpolation method used, by default None
dx (float, optional) – Size per pixel of the image data. If scalebar is required, dx and units must be sepcified. Defaults to None.
units (str, optional) – Units of dx. Defaults to None.
dimension (str, optional) –
Dimension of dx and units. Options include :
”si” : scale bar showing km, m, cm, etc.
”imperial” : scale bar showing in, ft, yd, mi, etc.
”si-reciprocal” : scale bar showing 1/m, 1/cm, etc.
”angle” : scale bar showing °, ʹ (minute of arc) or ʹʹ (second of arc).
”pixel” : scale bar showing px, kpx, Mpx, etc.
Defaults to None.
cbar (bool, optional) – Specify if a colorbar is required or not. Defaults to True.
orientation (str, optional) –
Specify the orientaion of colorbar. Option include :
’h’ or ‘horizontal’ for a horizontal colorbar to the bottom of the image.
’v’ or ‘vertical’ for a vertical colorbar to the right of the image.
Defaults to ‘v’.
cbar_log (bool, optional) – Log scale colormap and colorbar
cbar_label (str, optional) – Colorbar label. Defaults to None.
cbar_ticks (list, optional) – List of colorbar ticks. Defaults to None.
showticks (bool, optional) – Show image x-y axis ticks. Defaults to False.
despine (bool, optional) – Remove axes spines from image axes as well as colorbar axes. Defaults to None.
extent (list, optional) – Coordinates where to plot this image.
**kwargs (Additional parameters as keyword arguments to be passed to the underlying filter specified.) –
- Return type:
A seabron_image.ParamGrid object
- Raises:
TypeError – If row is not a str
ValueError – If row is specified without passing the parameter as a keyword argument
TypeError – If col is not a str
ValueError – If col is specified without passing the parameter as a keyword argument
ValueError – If col_wrap is specified when row is not None
Examples
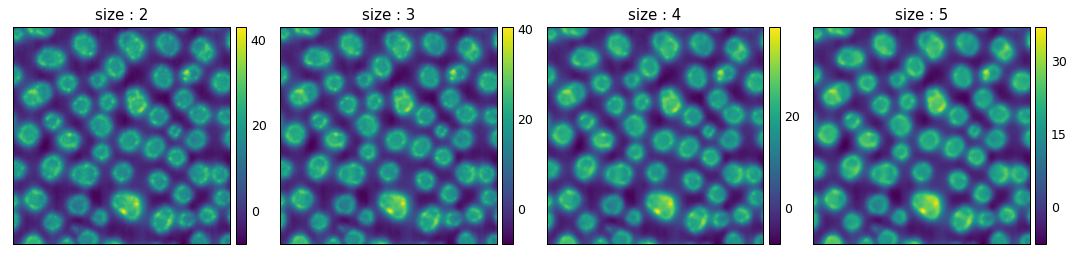
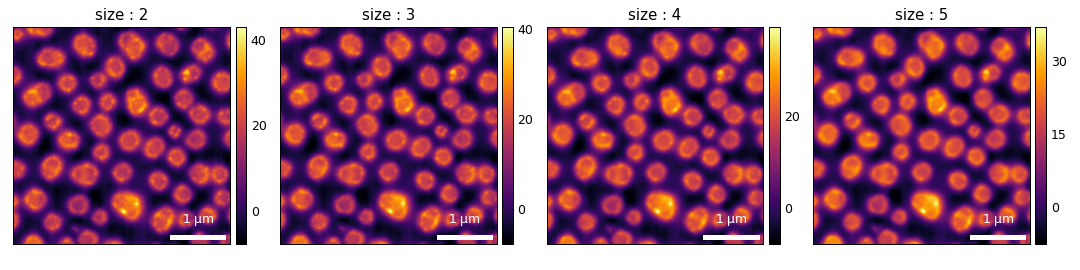
Specify a filter with different parameters along the columns
>>> import seaborn_image as isns
>>> img = isns.load_image("polymer")
>>> g = isns.ParamGrid(img, "median", col="size", size=[2,3,4,5])

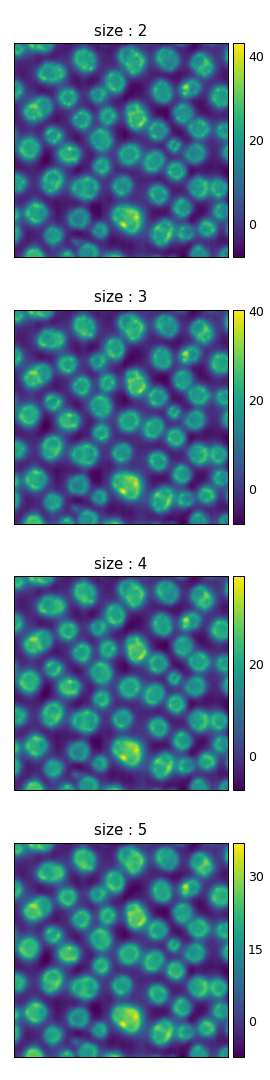
Or rows
>>> g = isns.ParamGrid(img, "median", row="size", size=[2,3,4,5])
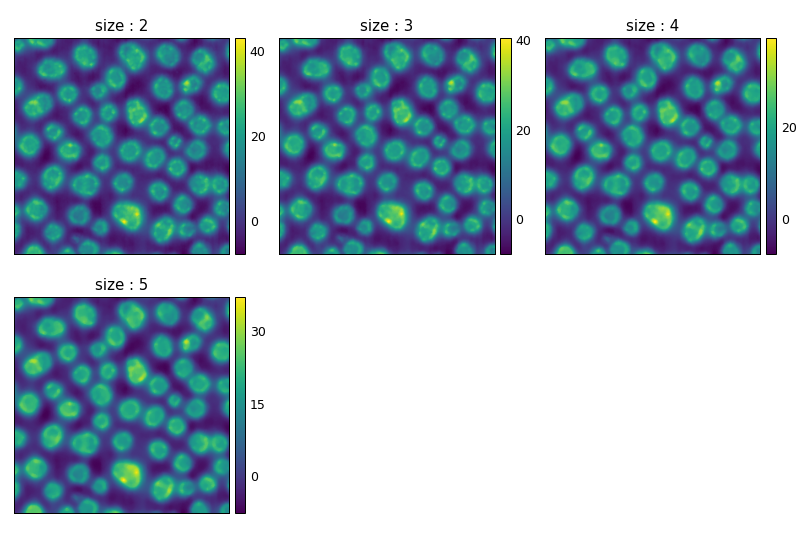
Use col_wrap to control column display
>>> g = isns.ParamGrid(img, "median", col="size", size=[2,3,4,5], col_wrap=3)
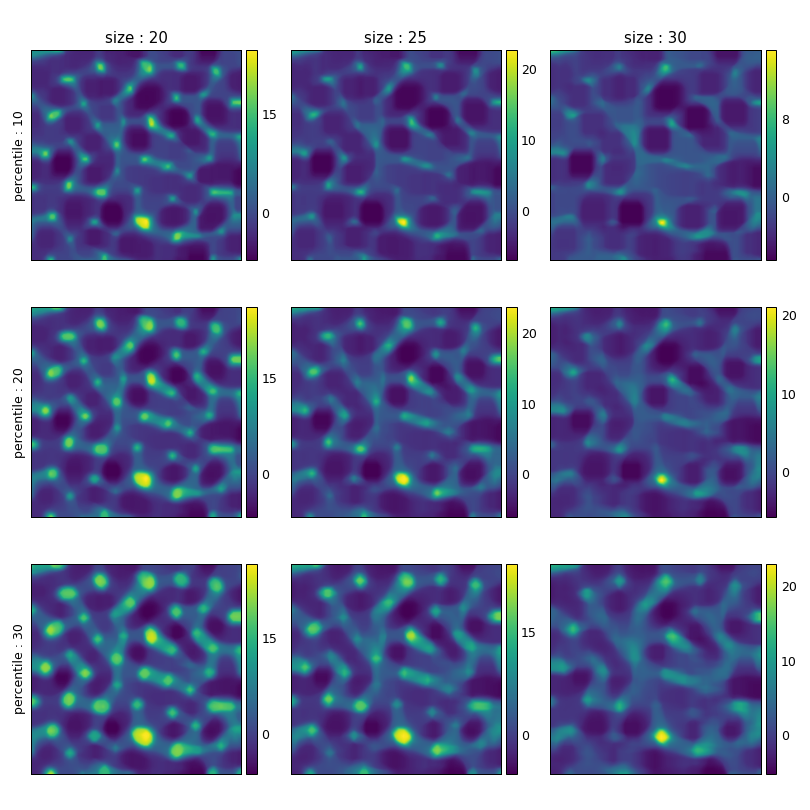
Use col and row to display different parameters along the columns and rows
>>> g = isns.ParamGrid(img,
...                     "percentile",
...                     row="percentile",
...                     col="size",
...                     percentile=[10,20,30],
...                     size=[20,25,30],)
Specify additional keyword arguments for the filter
>>> g = isns.ParamGrid(img, "median", col="size", size=[2,3,4,5], mode="reflect")
General image controls such as changing colormap, scalebar, etc.
>>> g = isns.ParamGrid(
...                     img,
...                     "median",
...                     col="size",
...                     size=[2,3,4,5],
...                     cmap="inferno",
...                     dx=15,
...                     units="nm")
- map_filter_to_grid()#
Map specified filter with row and col paramters to the image grid.