seaborn_image.ImageGrid#
- class seaborn_image.ImageGrid(data, *, slices=None, axis=None, step=1, start=None, stop=None, map_func=None, map_func_kw=None, col_wrap=None, height=3, aspect='auto', cmap=None, robust=False, perc=(2, 98), diverging=False, alpha=None, origin=None, vmin=None, vmax=None, interpolation=None, norm=None, dx=None, units=None, dimension=None, cbar=True, orientation='v', cbar_log=False, cbar_label=None, cbar_ticks=None, showticks=False, despine=None, extent=None)#
Figure level : plot a collection of 2-D or 3-D images or 3-D or 4-D image data along a grid. This class also supports slicing of the 3-D and 4-D image data along different axis with variable step sizes and start/end indexes.
- Parameters:
data – 3-D or 4-D Image data (array-like), or list of 2-D or 3-D image data. Supported array shapes are all matplotlib.pyplot.imshow array shapes
slices (int or list, optional) – If data is 3-D or 4-D, slices will index the specific slice from the last axis and only plot the resulting images. If None, it will plot all the slices from the last axis, by default None
axis (int, optional) – Axis along which the data will be sliced, by default -1 for 3-D arrays and 0 for 4-D arrays
step (int, optional) – Step along the given axis, by default 1
start (int, optional) – Starting index to select from the the data, by default None
stop (int, optional) – Stopping index to select from the data, by default None
map_func (callable or list/tuple or callables, optional) – Transform input image data using this function. All function arguments must be passed as map_func_kw.
map_func_kw (dict or list/tuple of dict, optional) – kwargs to pass on to map_func. Must be dict for a single map_func and a list/tuple of dicts for a list/tuple of map_func
col_wrap (int, optional) – Number of columns to display. Defaults to None.
height (int or float, optional) – Size of the individual images. Defaults to 3.
aspect (int, float or 'auto', optional) – Aspect ratio of individual images, when set to ‘auto’, it calculates the aspect ratio of the images passed. Defaults to ‘auto’.
cmap (str or matplotlib.colors.Colormap or list, optional) – Image colormap. If input data is a list of images, cmap can be a list of colormaps. Defaults to None.
robust (bool or list, optional) – If True, colormap range is calculated based on the percentiles defined in perc parameter. If input data is a list of images, robust can be a list of bools, by default False
perc (tuple or list, optional) – If robust is True, colormap range is calculated based on the percentiles specified instead of the extremes, by default (2, 98) - 2nd and 98th percentiles for min and max values. Can be a list of tuples, if input data is a list of images
diverging (bool or list, optional) – If True, vmax and vmin are adjusted so they have the same absolute value, making the diverging color maps show 0 at the middle.
alpha (float or array-like, optional) – matplotlib.pyplot.imshow alpha blending value from 0 (transparent) to 1 (opaque), by default None
origin (str, optional) – Image origin, by default None
vmin (float or list of floats, optional) – Minimum data value that colormap covers, by default None
vmax (float or list of floats, optional) – Maximum data value that colormap covers, by default None
interpolation (str, optional) – matplotlib.pyplot.imshow interpolation method used, by default None
norm (matplotlib.colors.Normalize or list of matplotlib.colors.Normalize, optional) – matplotlib Normalize instance used to scale scalar data before mapping to colors using cmap.
dx (float or list, optional) – Size per pixel of the image data. If scalebar is required, dx and units must be sepcified. Can be a list of floats, if input data is a list of images. Defaults to None.
units (str or list, optional) – Units of dx. Can be a list of str, if input data is a list of images. Defaults to None.
dimension (str or list, optional) –
Dimension of dx and units. Options include :
”si” : scale bar showing km, m, cm, etc.
”imperial” : scale bar showing in, ft, yd, mi, etc.
”si-reciprocal” : scale bar showing 1/m, 1/cm, etc.
”angle” : scale bar showing °, ʹ (minute of arc) or ʹʹ (second of arc).
”pixel” : scale bar showing px, kpx, Mpx, etc.
Can be a list of str, if input data is a list of images. Defaults to None.
cbar (bool or list, optional) – Specify if a colorbar is required or not. Can be a list of bools, if input data is a list of images. Defaults to True.
orientation (str, optional) –
Specify the orientaion of colorbar. Option include :
’h’ or ‘horizontal’ for a horizontal colorbar to the bottom of the image.
’v’ or ‘vertical’ for a vertical colorbar to the right of the image.
Defaults to ‘v’.
cbar_log (bool, optional) – Log scale colormap and colorbar
cbar_label (str or list, optional) – Colorbar label. Can be a list of str, if input data is a list of images. Defaults to None.
cbar_ticks (list, optional) – List of colorbar ticks. Defaults to None.
showticks (bool, optional) – Show image x-y axis ticks. Defaults to False.
despine (bool, optional) – Remove axes spines from image axes as well as colorbar axes. Defaults to None.
extent (floats (left, right, bottom, top), optional) – The bounding box in data coordinates that the image will fill. The image is stretched individually along x and y to fill the box.
- Return type:
A seaborn_image.ImageGrid object
- Raises:
ValueError – If data is None
ValueError – If data has 1 dimension
ValueError – If data has more than 4 dimensions
ValueError – If data contains a 4D image within a list of images
ValueError – If axis is not 0, 1, 2 or -1
TypeError – If map_func is not a callable object or a list/tuple of callable objects
ValueError – If map_func is a list/tuple of callable objects when data is 3D or 4D
Examples
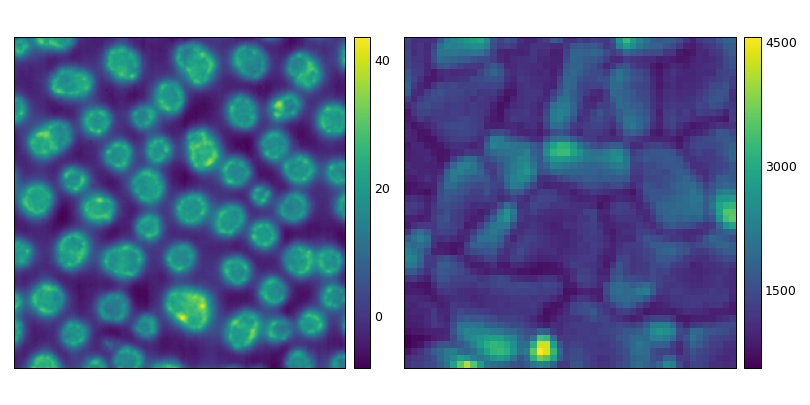
Plot a collection of images
>>> import seaborn_image as isns
>>> pol = isns.load_image("polymer")
>>> pl = isns.load_image("fluorescence")
>>> g = isns.ImageGrid([pol, pl])
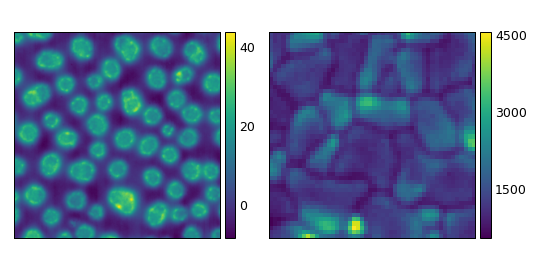
Common properties across images
>>> g = isns.ImageGrid([pol, pl], cmap="inferno")
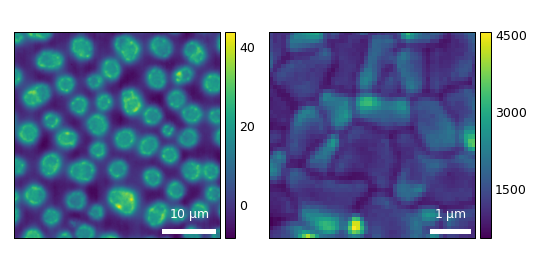
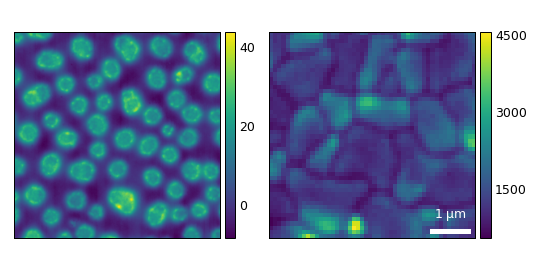
Different scalebars for different images
>>> g = isns.ImageGrid([pol, pl], dx=[0.15, 0.1], units="um")
Specify properties only for specific images
>>> g = isns.ImageGrid([pol, pl], dx=[None, 100], units=[None, "nm"])
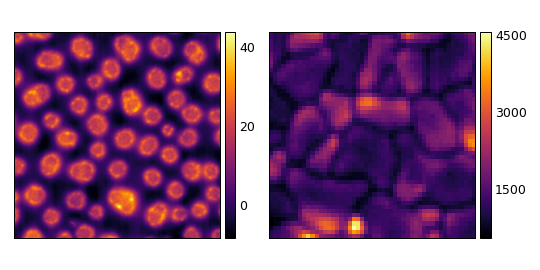
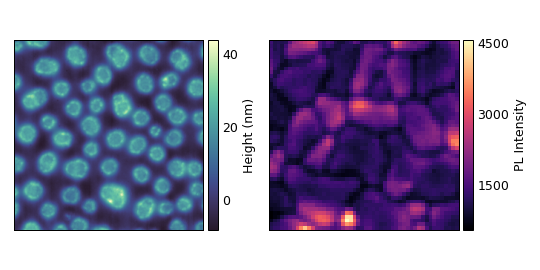
Different colormaps and colorbar titles
>>> g = isns.ImageGrid([pol, pl], cmap=["deep", "magma"], cbar_label=["Height (nm)", "PL Intensity"])
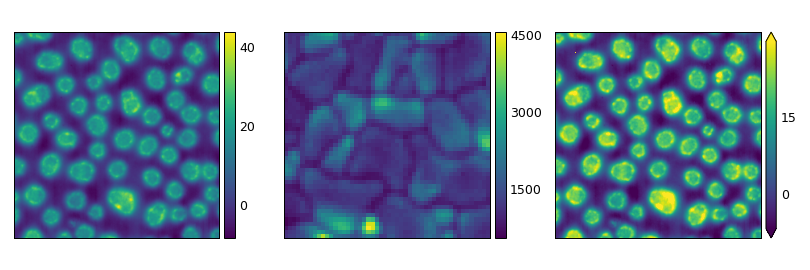
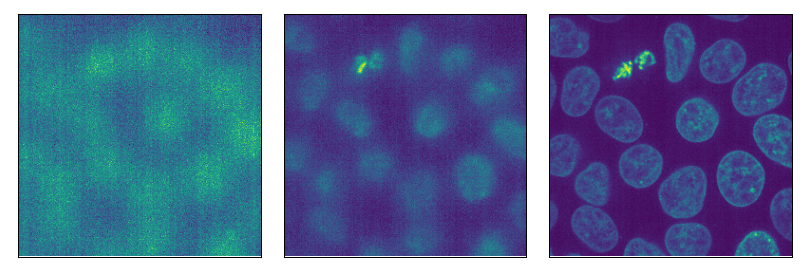
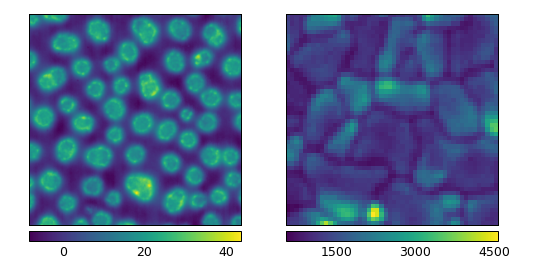
Correct colormap for outliers
>>> pol_out = isns.load_image("polymer outliers")
>>> g = isns.ImageGrid([pol, pl, pol_out], robust=[False, False, True], perc=[None, None, (0.5, 99.5)])
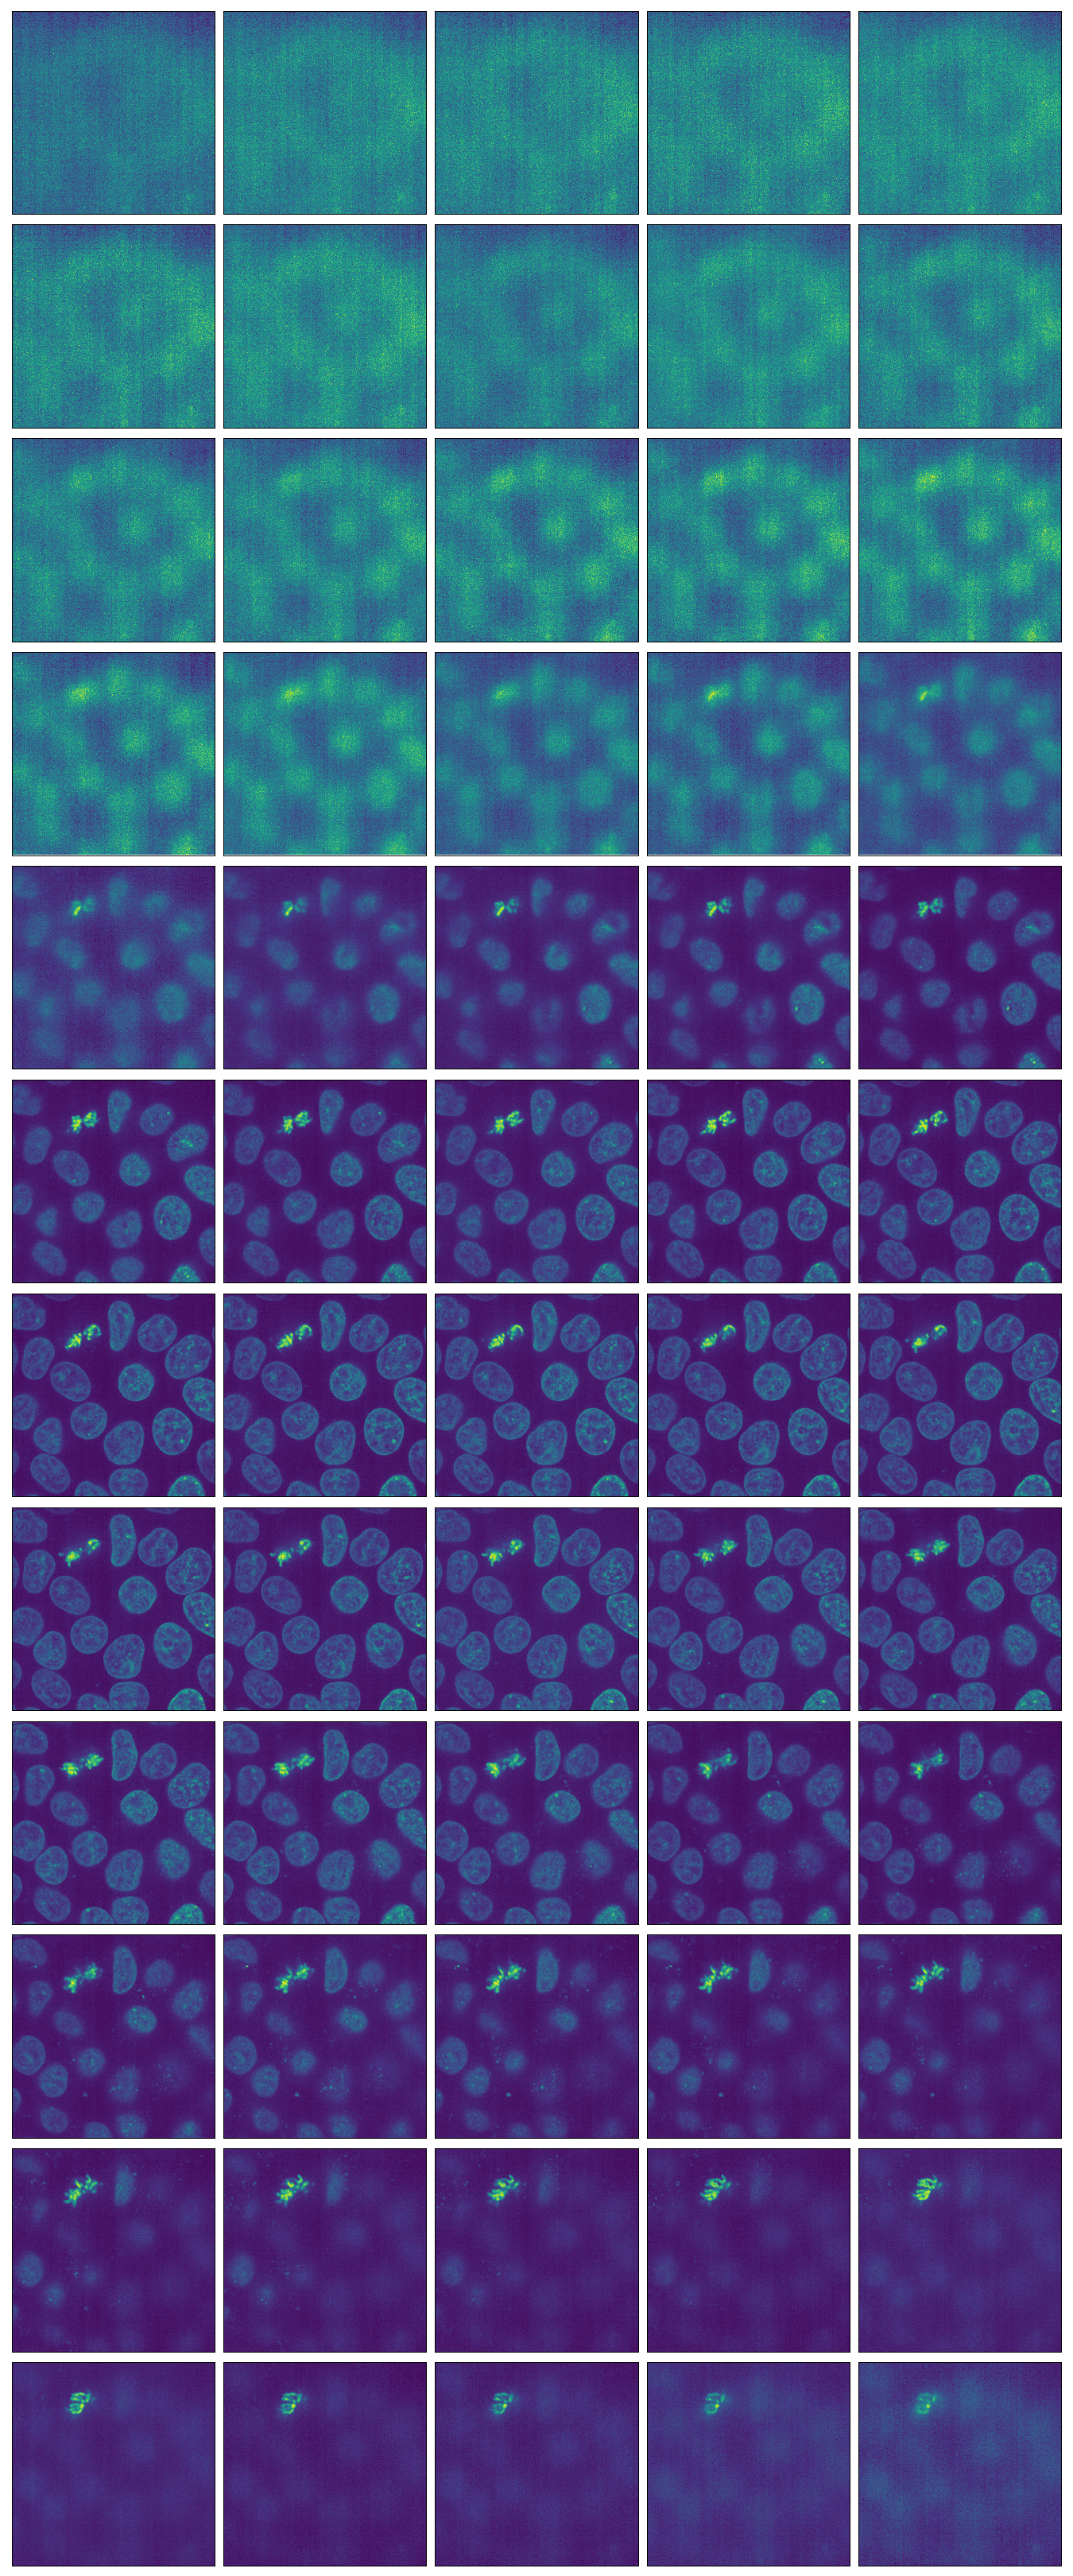
Plot 3-D images; control number of columns
>>> cells = isns.load_image("cells")
>>> g = isns.ImageGrid(cells, col_wrap=5, cbar=False)
Plot specific slices of the 3-D data cube
>>> g = isns.ImageGrid(cells, slices=[10, 20, 30], cbar=False)
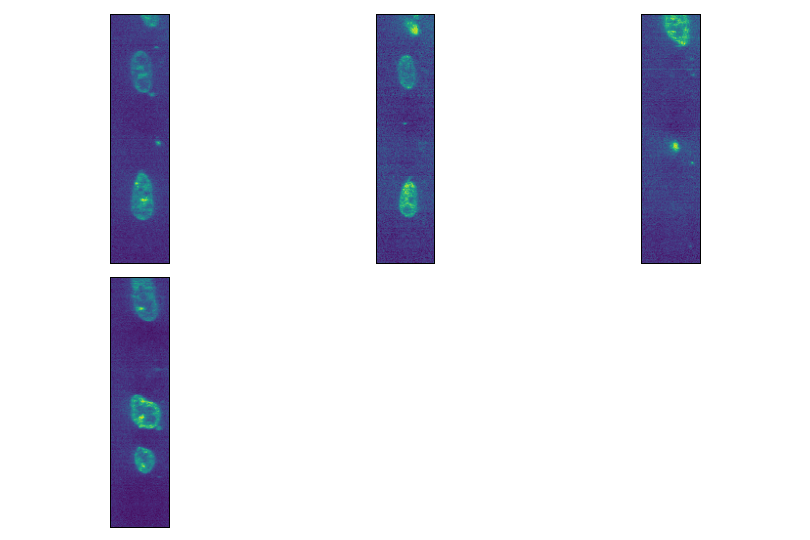
Slice along different axis
>>> g = isns.ImageGrid(cells, slices=[0, 4, 10, 32], axis=0, cbar=False)
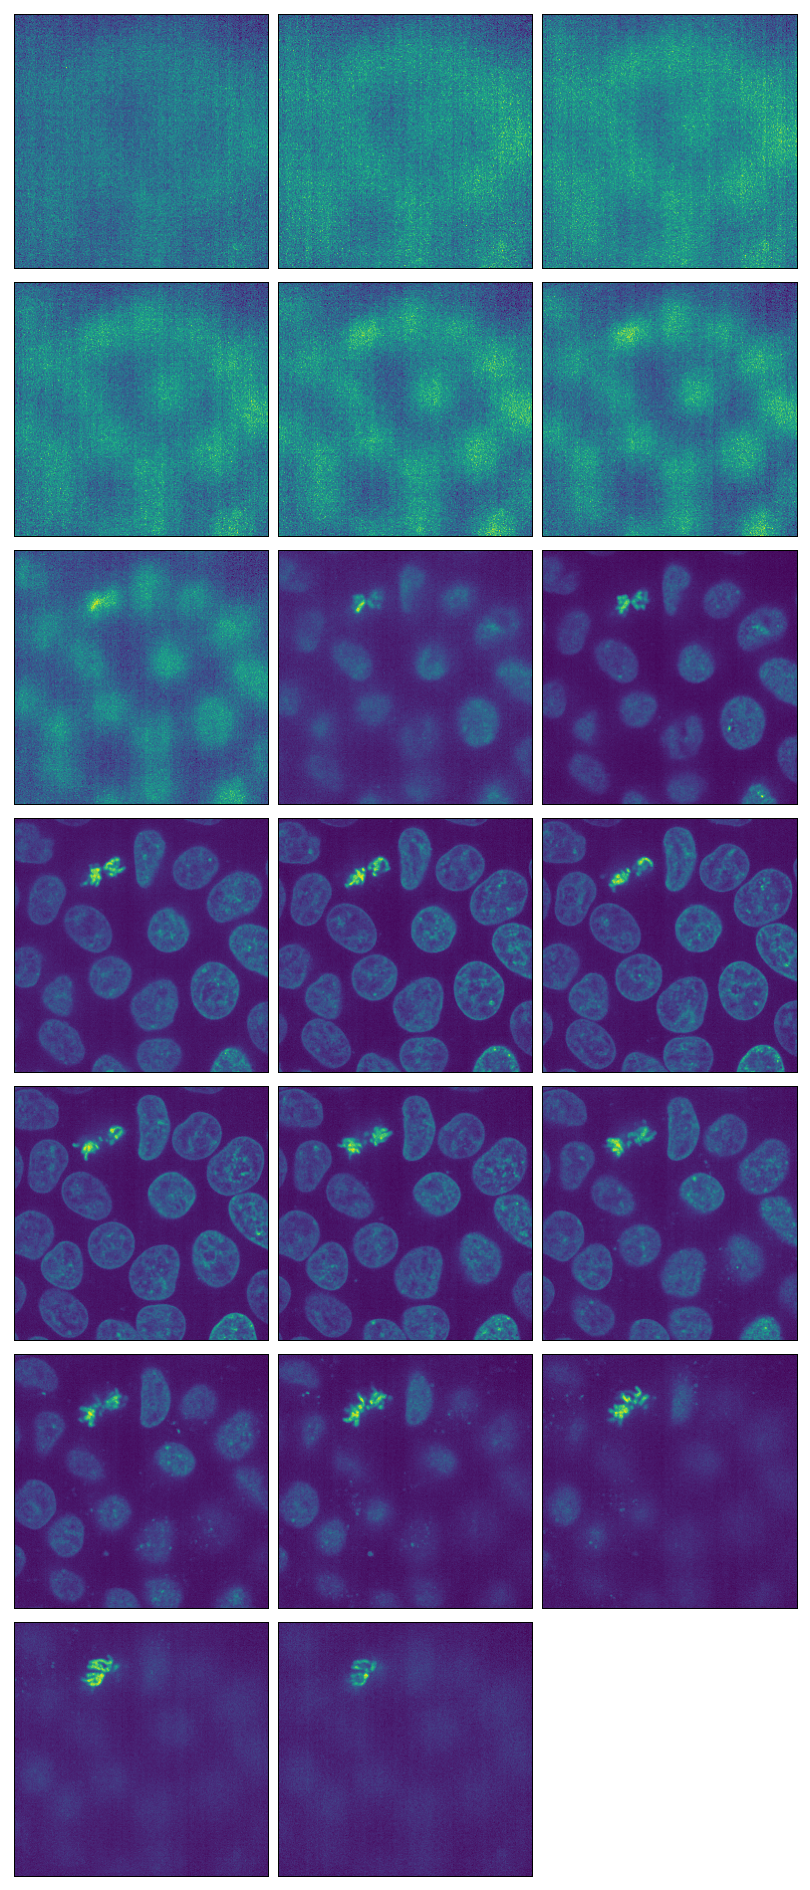
Select indexes with a specifc step size
>>> g = isns.ImageGrid(cells, step=3, cbar=False)
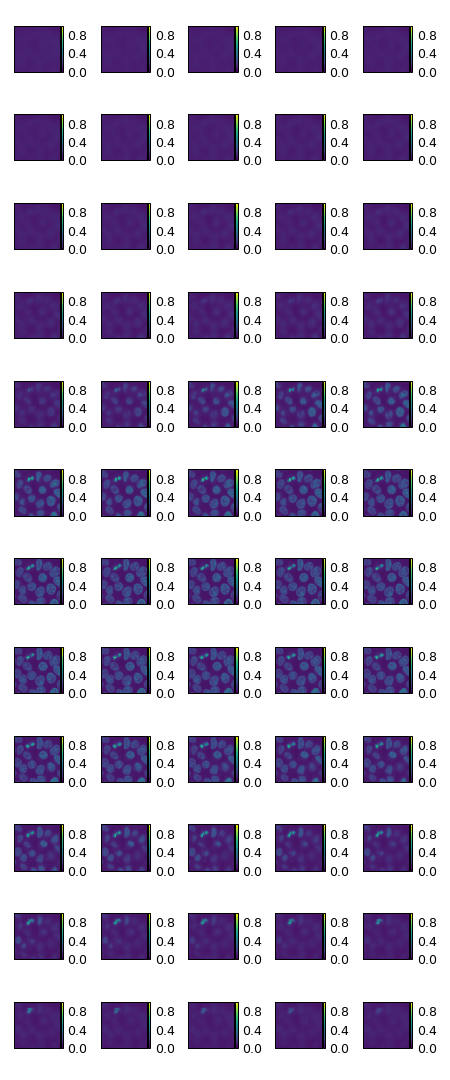
Visulaize image intensities relative to other images on the grid
>>> g = isns.ImageGrid(cells, vmin=0, vmax=1, height=1, col_wrap=5)
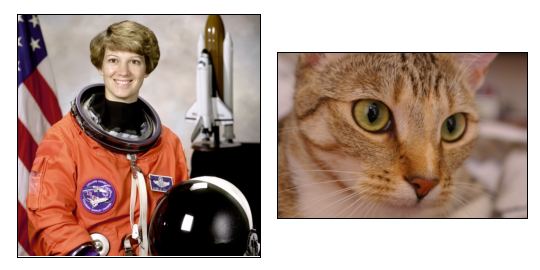
Plot a list of 3-D images
>>> from skimage.data import astronaut, chelsea
>>> g = isns.ImageGrid([astronaut(), chelsea()], origin="upper")
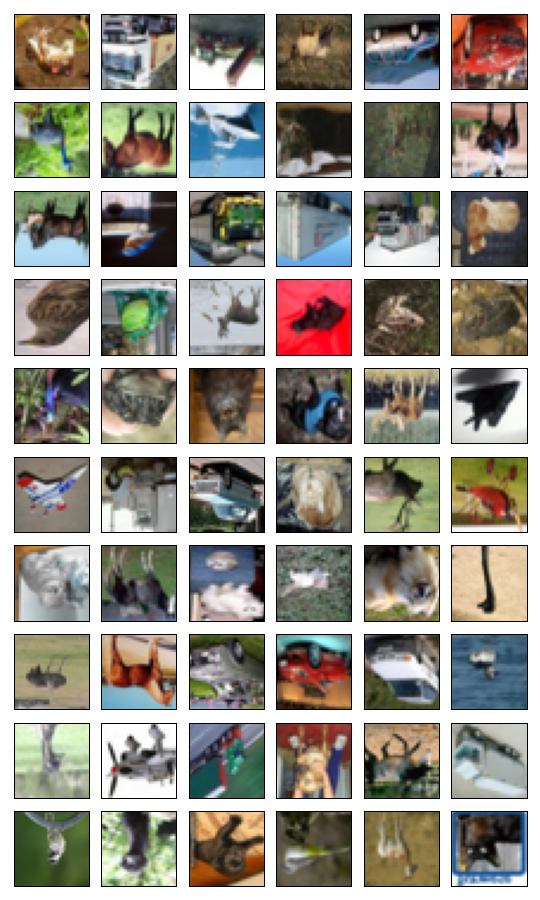
Plot 4-D image data cube
>>> cifar = isns.load_image("cifar10")
>>> g = isns.ImageGrid(cifar, height=1, col_wrap=6, origin="lower")
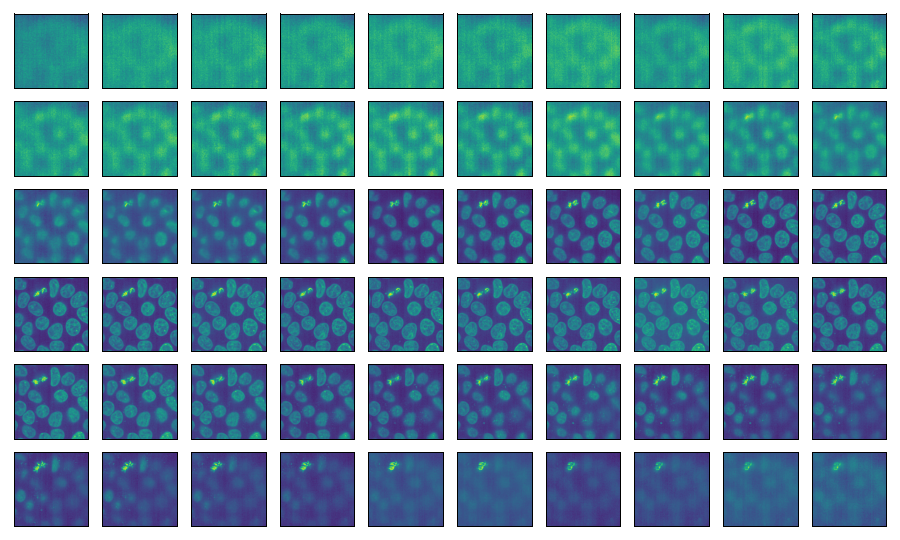
Map a function to the image data
>>> from skimage.exposure import adjust_gamma
>>> g = isns.ImageGrid(
...             cells,
...             map_func=adjust_gamma,
...             map_func_kw={"gamma" : 0.5},
...             cbar=False,
...             height=1,
...             col_wrap=10)
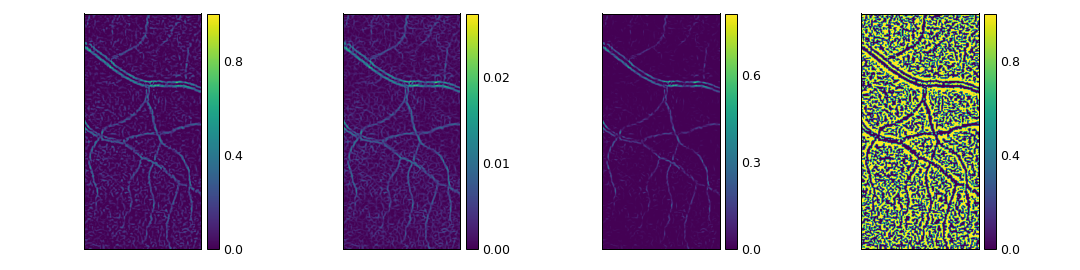
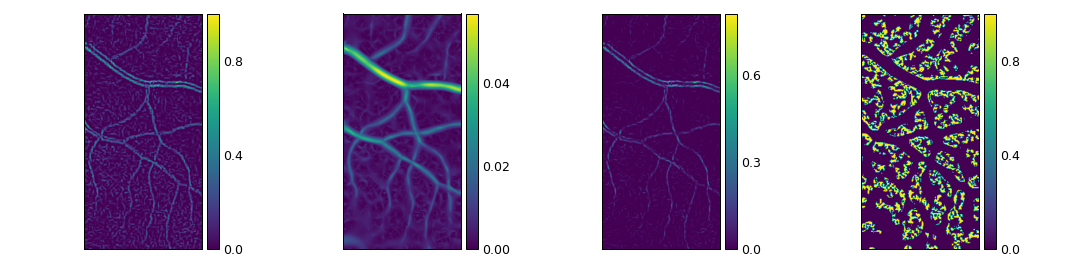
Map a list of functions to the input data. Pass function kwargs to map_func_kw.
>>> from skimage.filters import meijering, sato, frangi, hessian
>>> retina = isns.load_image("retina-gray")
>>> g = isns.ImageGrid(
...             retina,
...             map_func=[meijering, sato, frangi, hessian],
...             col_wrap=4,
...             map_func_kw=[{"mode" : "reflect", "sigmas" : [1]} for _ in range(4)])
If no kwargs are required for one or more of the functions, use None.
>>> g = isns.ImageGrid(
...             retina,
...             map_func=[meijering, sato, frangi, hessian],
...             col_wrap=4,
...             map_func_kw=[{"mode" : "reflect", "sigmas" : [1]}, None, None, None])
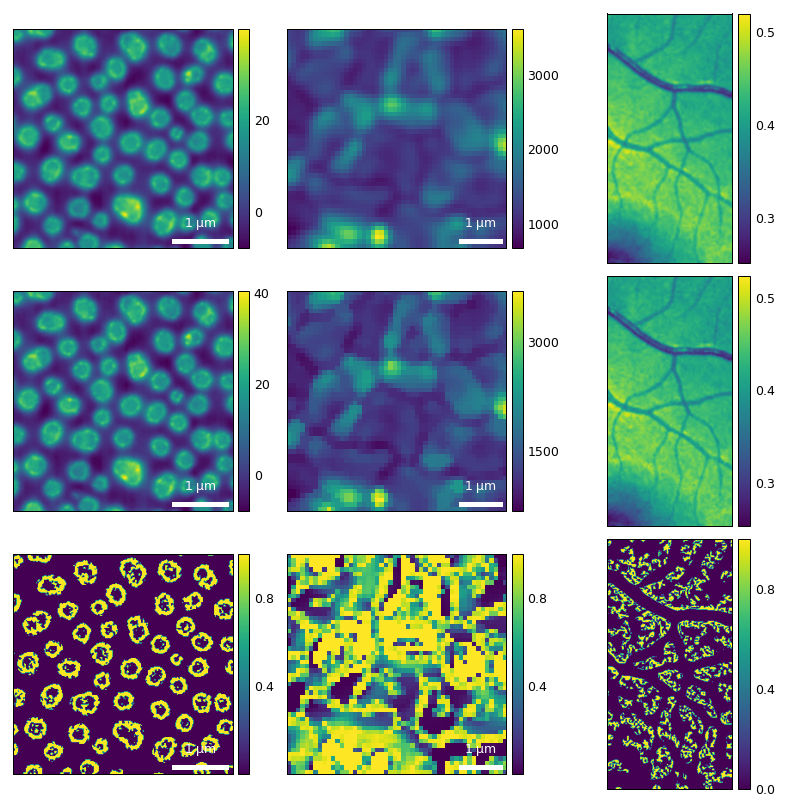
Apply a list of filters to a list of input images.
>>> from skimage.filters import gaussian, median
>>> g = isns.ImageGrid(
...             [pol, pl, retina],
...             map_func=[gaussian, median, hessian],
...             dx=[15, 100, None],
...             units="nm",
...             aspect=1)
Change colorbar orientation
>>> g = isns.ImageGrid([pol, pl], orientation="h")
Change figure size using height
>>> g = isns.ImageGrid([pol, pl], height=4.5)